Plot a shaded sound waveform in MATLAB
The following code processes an input sound waveform and outputs its envelope-like style plot:
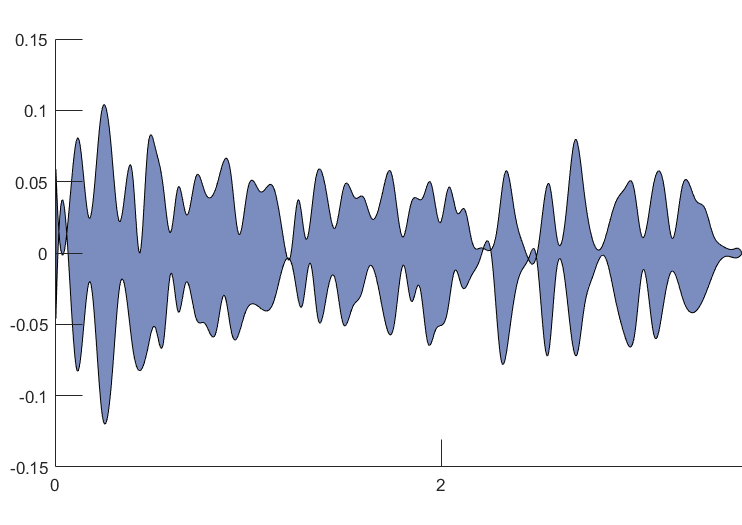
This might come in handy for various illustrational purposes. Feel free to modify the parameters.
%%%%%%%%%%%%%%%%%%%%%%%%%%%%%%%%%%%%%%%%%%%%%%%%
% Plot audio waveform area based on its envelope
% Author: Vojtech Illner
% March 2022
%%%%%%%%%%%%%%%%%%%%%%%%%%%%%%%%%%%%%%%%%%%%%%%%

% read the given input audio
[audio, fs] = audioread("sound.wav");

% specify how much to decimate the signal
% without decimating the number of operations is too big
decim = 500;
% specify the length of the smoothing window when computing the envelope
% this mostly depends on the signal duration and desired detail
envelopeSmooth = 3800;

[eUp, eLo] = envelope(audio, envelopeSmooth, 'peak');
xAx = linspace(1, length(audioCut), length(audioCut))';
xAx = xAx(1:decim:end)';
xAx = [xAx, fliplr(xAx)];
eUp = eUp(1:decim:end)'; eLo = eLo(1:decim:end)';
yAx = [eUp, fliplr(eLo)];

% specify the color as RGB triplet
color = [123/255, 141/255, 191/255];

figure(1)
fill(xAx, yAx, color)
box off